
An Example of Doing a Moss Quality Assessment Index, with Implications for Future OMLA Work
Introduction
The Floristic Quality Assessment Index (FQAI) is an index that helps to provide a more objective look at the quality of different vegetative habitats. It has been widely used to evaluate vascular plant communities in parts of the US. This is an improvement over saying that site looks good or that site does not look so great. This kind of valuations can differ from individual to individual.
The FQAI works through the use of coefficients of conservatism (CofC). On a scale from 0 to 10, these range from plants with very wide ecological tolerances to very narrow tolerances. Once the CofCs have been assigned, the FQAI can be determined by the following formula: 𝐹𝑄𝐴𝐼 = (∑ CofC)/√(N) where the CofCs for a site are added up and divided by the square root of the number of species.
Examining Google Scholar, it appears that Ohio may be the only state having an established and published list of CofCs developed for mosses, although there has been past talk of doing so for a couple other states. This is due to the work of OMLA’s Barb Andreas, who pioneered their use for mosses. She also did significant work for developing the FQAI for vascular plants in Ohio. See the publication: Floristic quality assessment index (FQAI) for vascular plants and mosses for the State of Ohio by Andreas, Mack and McCormack. In addition to a link below, a snippet of it is included (See under Citations: Andreas, et.al., 2004)
https://epa.ohio.gov/static/Portals/35/wetlands/Ohio_FQAI.pdf
Those values were used in an Ohio EPA wetland project that I worked on with Brian Gara, former Ohio EPA wetland ecologist. Exploring the quality of 50 wetlands with selected 10X10 meter plots per site, across Ohio over a four year period, the use of an FQAI for mosses and bryophytes (Moss QAI ad Bryophyte QAI since mosses and liverworts have no floral parts), sites across Ohio showed a high correlation between vascular plants and bryophytes as indicators of wetland quality in Ohio. The study, Intensification of the National Wetland Condition Assessment for Ohio: Final Report by Gara and Schumacher can be viewed at the link below (See under Citations: Gara, et.al., 2015).
https://epa.ohio.gov/static/Portals/35/wetlands/Ohio_Intensification_Final_Report_2015 1014.pdf
Note: From this study, three peer reviewed articles have been published in regards to using mosses and bryophytes (including liverworts). See under Citations: Schumacher, et. al, 2016; Stapanian, et.al., 2016a; Stapanian, et.al., 2016b.
Case Example
I decided to try to show an example of how CofC and the resultant Moss QAI score could be used to compare different sites. In the Laporte/Porter County Foray that we did in April 2023 (see proceeding article), one of the sites collected was Ambler Flatwoods Nature Preserve. The analysis below is for illustrative purposes only. Although the CofCs were developed for Ohio, since Indiana is right beside Ohio with similar ecological conditions, they are being used although with a bit of caution if used on a regular basis.
For proper methodology, application and cautions, read introductory material in the Andreas et. Al. report mentioned above.
Ambler Flatwoods Nature Preserve is a boreal flatwood, which is characterized by poorly drained soils on a relatively level or “flat” landscape. In general terms it is a forested wetland. Being in northern IN and right beside Lake Michigan give it an unusually colder habitat than is usual for IN. This boreal flatwood natural community is found nowhere else in Indiana and is a haven for plants typically found much farther north.
The preserve has several sections. The sections compared here are: 1) a section in the middle that is an older mature forest and 2) a section just to the north which is more secondary in nature. In the map, the more secondary section is red and the more mature forest section is yellow. Both are roughly similar in size. Both sites were explored primarily by two people, for several hours. Both sites had large quantities of moss plants.
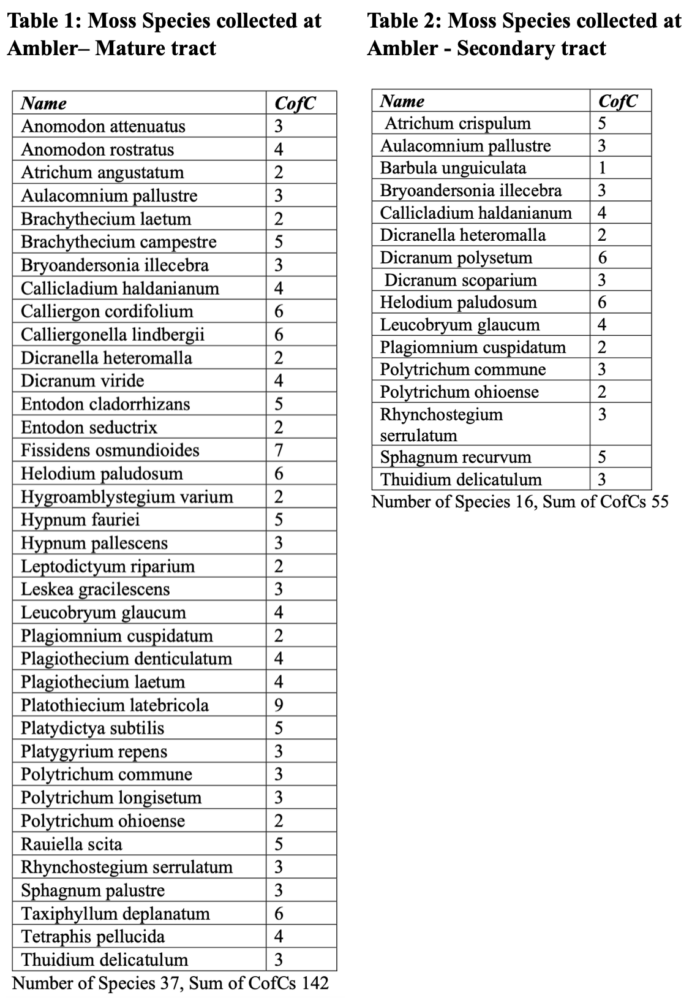
The number of species collected in the mature portion was 37, with a sum of CofC at 142 (Table 1 below). The number of species collected in the secondary portion was 16, with a sum of CofC of 55 (Table 2 below). Each table also shows the species collected with their corresponding CofC.
Doing the calculations results in a Moss QAI score of 23.3 for the mature area and 13.75 for the secondary area.
Discussion
We now have a value that provides a more objective way of determining the quality of these areas. From past work with Ohio forested wetlands, the value for the Ambler mature area indicates a wetland that provides a high level of functions, whereas the secondary tract Moss QAI indicates a lower level of functions. That does not mean that the secondary site is a poor site, but in this case it probably means it is still relatively immature and has not developed all the niches that the more mature forest has for moss diversity. In 10 or 20 years it could be revisited and a new Moss QAI done to see how it has changed. Without that or a similar index, we would be left making more subjective guesstimates.
In addition to the Moss QAI value itself, it is useful to look at the individual species in the lists and their corresponding CofC values. The mature area has 10 species with CofC values ≥ 5. This indicates a high percentage species found in niches that have a narrower ecological tolerance, something more likely to be found in older growth forests. The secondary tract has 4 such species, less than the older growth area, which is expected. However, their presence also indicates that this area is on a trajectory that will eventually lead to a stable mature forest, especially with its close proximity to the mature area.
The Moss QAI can also tell us other things about a site. Mosses (and liverworts) are more sensitive to disturbance than vascular plants. If a site has a relatively high vascular plant FQAI but a Moss QAI that shows a lower quality site, there could be something going on that the vascular plant FQAI has not picked up. And it should be noted that using mosses can be done most of the year as an indicator, unlike vascular plants that have a limited growing season.
Such examples have been observed several times in my experience. Old growth forests have shown very good vascular plant diversity, both trees and forbs, but mediocre bryophyte diversity. This has been seen when the forested area has experienced a significant amount of air pollution or been surrounded by agricultural row crop land. Pollutants from factories, cars or from herbicide drift come in and affect the bryophyte community much harder. In these cases, the bryophyte community acts like a canary in the coal mine showing a danger to the forested area before the vascular plant community can respond.
Other damaging activity that a lower Moss QAI could signal is soil disruptions that slow down reforestation efforts, a very serious and widespread problem with reforestation efforts after clear cutting or from ag land where the soil was not adequately protected. Lowering of the water table in a sensitive area, something I have seen at some premier nature preserves, is another example.
Importance of sampling the community
Sampling the bryophyte community is key to the ability to make the observations above. There is a lot of useful information provided by just looking at small areas for what can be found, or looking for certain species. I do this a lot myself. But that cannot provide a substitute for looking at the community. In fact, the information provided by individual or rare species is, in the context of community of the larger natural area. Looking at the community takes work collecting all the species in an area and then identifying them, but it is important work and provides information that cannot be gotten other ways.
Conclusions
Ohio is blessed to have CofCs and ability to do Moss QAIs, something hardly any other state has. In addition, we have a high amount of bryophyte data that most states do not have due to the hard work of OMLA. Ohio also has successful work using the Moss CofC information for research in using mosses and liverworts as an indicator for wetland quality.
In addition to making collections lists, looking at this data with an ecological lens and doing additional analysis with CoC could be very productive and rewarding. The logical next steps, if there was interest, are to see if a moss or bryophyte CoC could be used as an indicator for other habitats besides wetlands (e.g. upland forests). Also, having a set of CofCs for liverworts for Ohio would be helpful in complementing the moss set of CofCs for Ohio.
Note: For the Ohio EPA study, Barb Andreas and Diane Lucas helped to provide estimates for CoC values for liverworts and a few mosses that previously did not have CofC scores.
Citations
1. Andreas, Barbara K., John J. Mack, and James S. McCormac. 2004. Floristic Quality Assessment Index (FQAI) for vascular plants and mosses for the State of Ohio. Ohio Environmental Protection Agency, Division of Surface Water, Wetland Ecology Group, Columbus, Ohio. 219 p.
2. Gara, Brian and Schumacher, Bill. 2015. Intensification of the National Wetland Condition Assessment for Ohio: Final Report. Ohio EPA Technical Report WET/2015-1. Ohio Environmental Protection Agency, Wetland Ecology Group, Division of Surface Water. Columbus, Ohio.
3. Schumacher W., Stapanian M.A., Andreas B.K., Gara B. 2016. Number of genera as a potential screening tool for assessing quality of bryophyte communities in Ohio wetlands. Wetlands 36:771–776.
4. Stapanian M.A., Schumacher W., Adams J.V., Gara B., Viau N. 2016a. Moss and vascular plant indices in Ohio wetlands have similar environmental predictors. Ecological Indicators 62: 138–146.
5. Stapanian M.A., Schumacher W., Gara B., Viau N. 2016b. Mosses in Ohio wetlands respond to indices of disturbance and vascular plant integrity. Ecological Indicators 63:110–120.
-Bill Schumacher